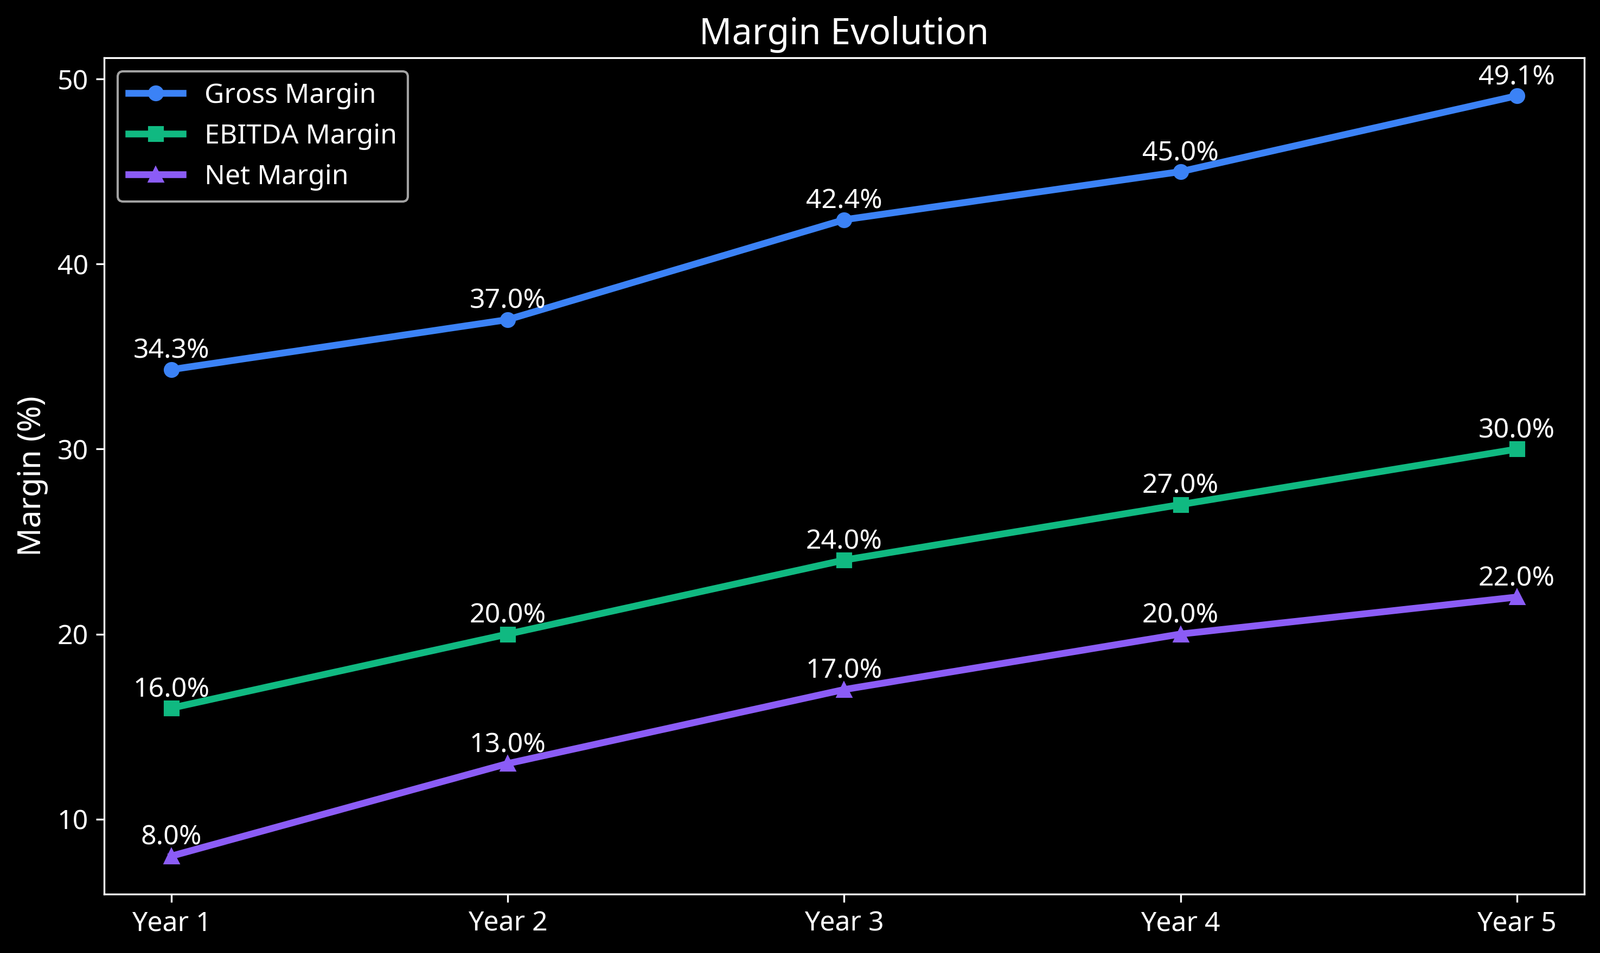
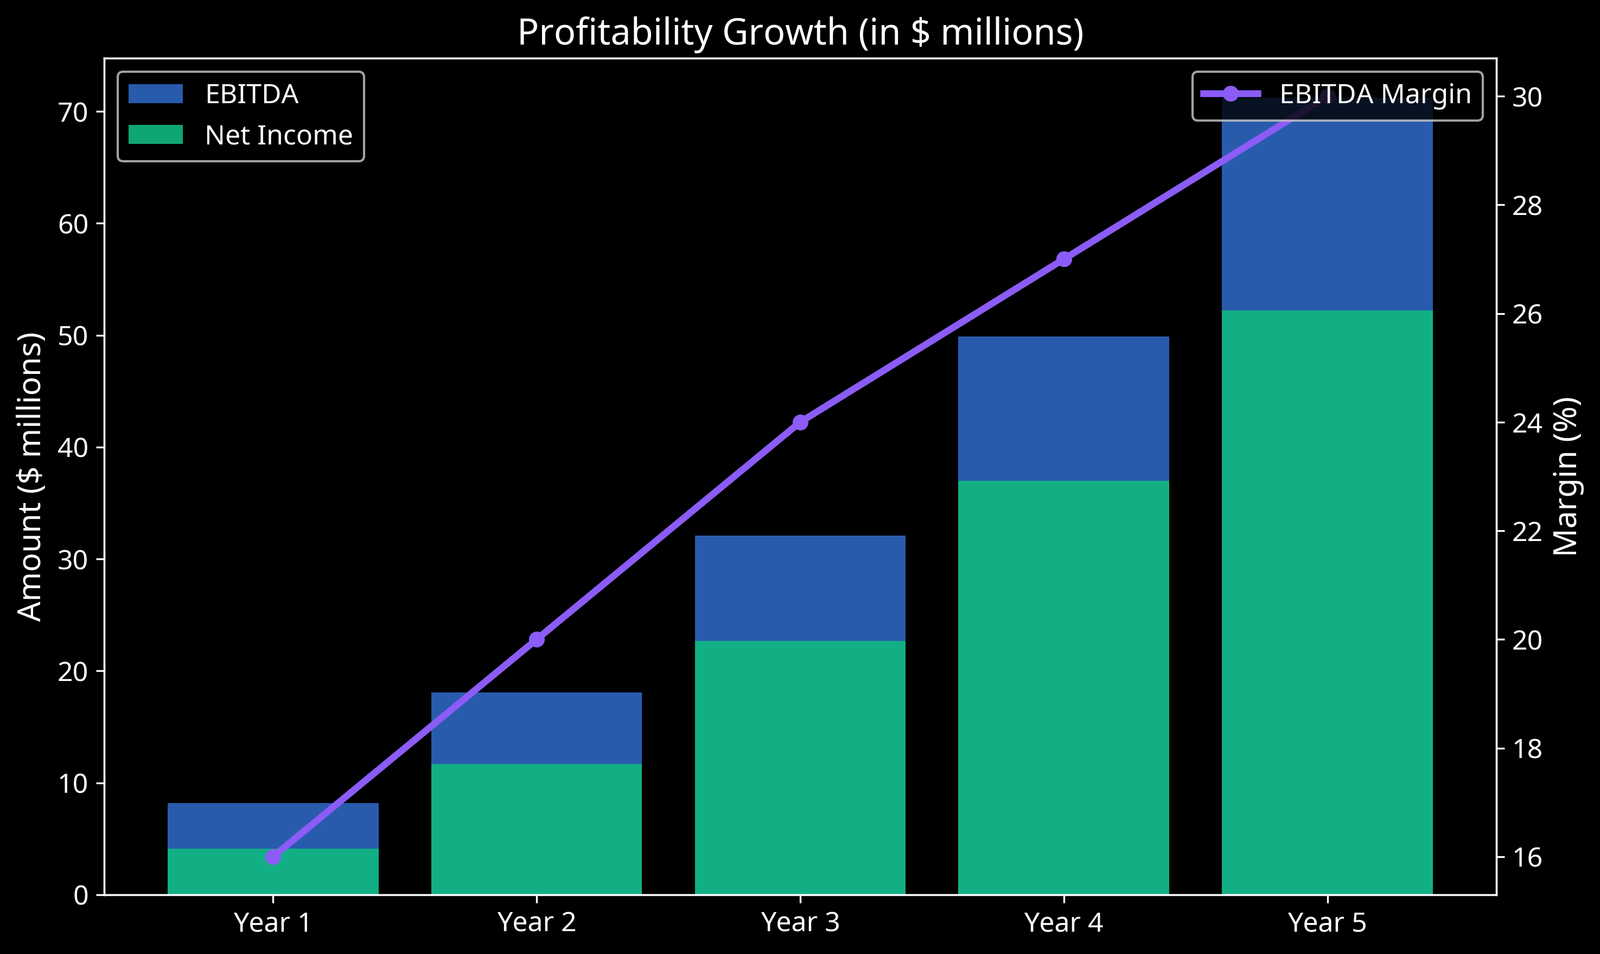
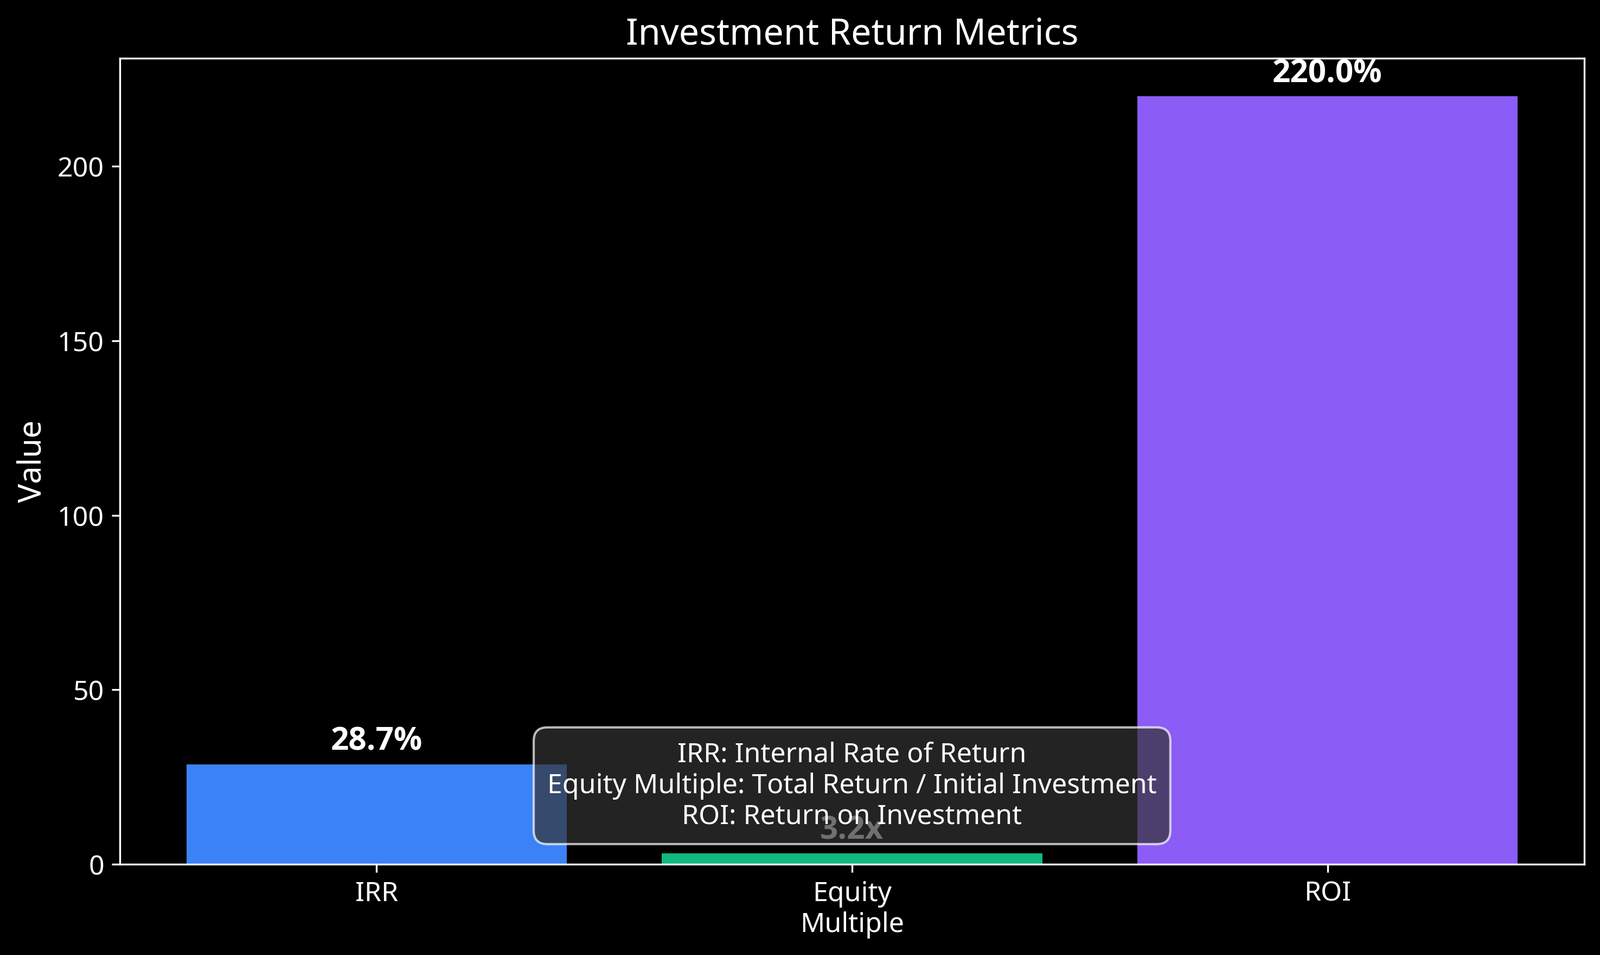
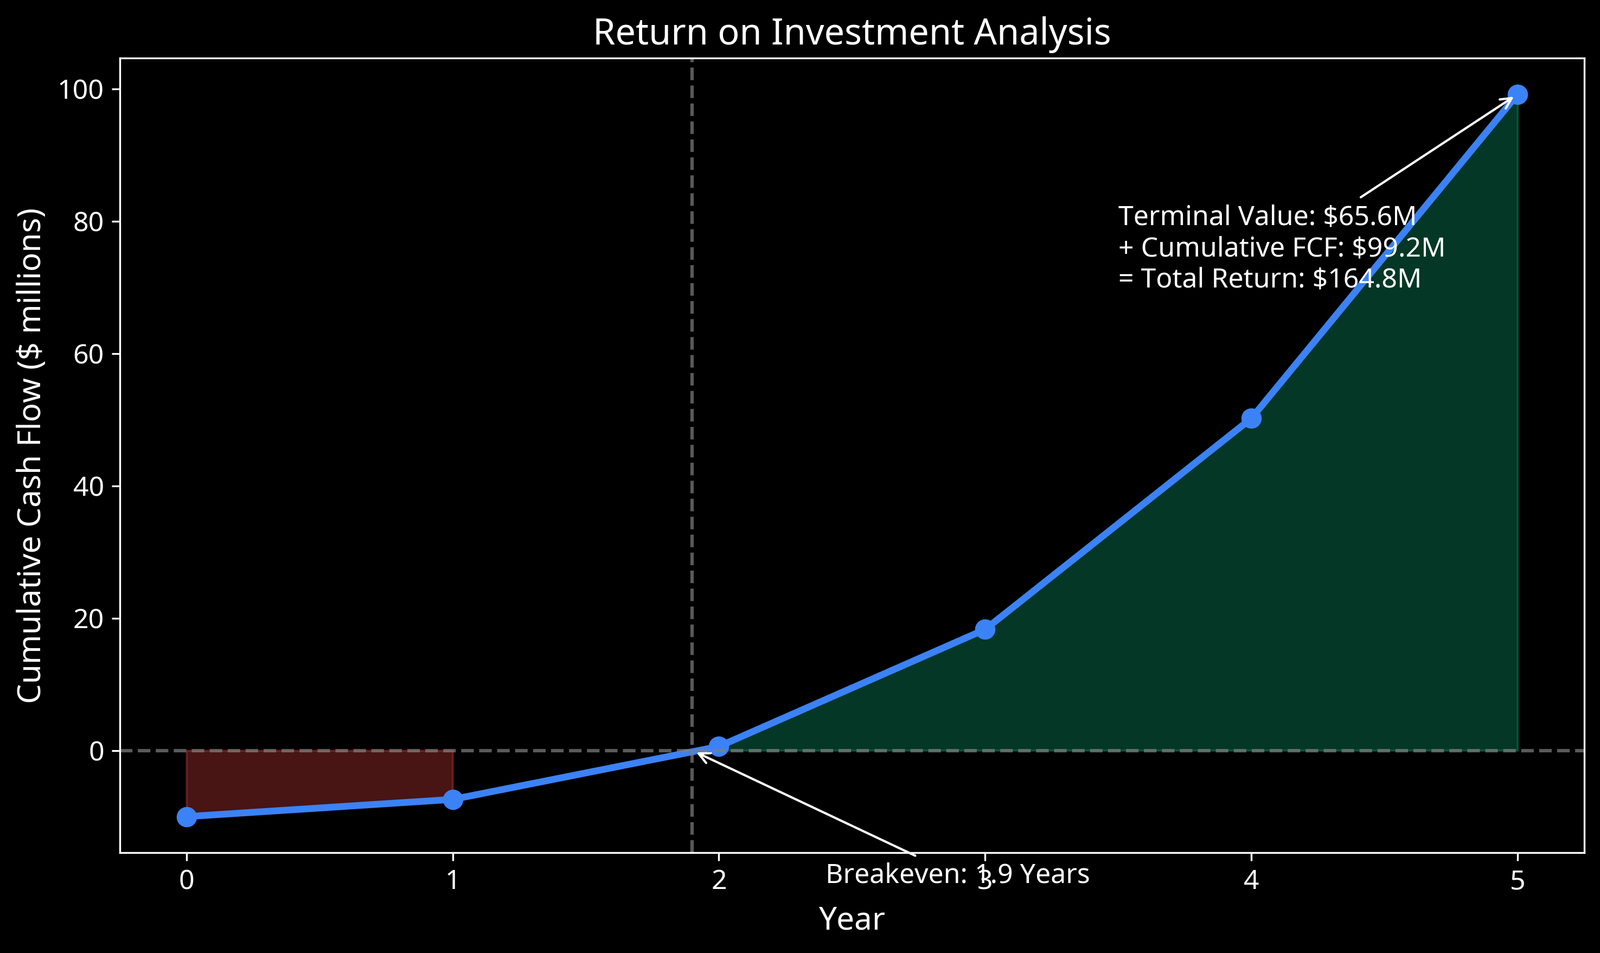
This financial projection outlines the expected performance of Zolair Energy Solutions Limited over a five-year period following the $10 million equity investment. The company's integrated e-tricycle and sodium-ion battery assembly plants are projected to achieve profitability by Year 3, with a cumulative EBITDA of $31.2 million by the end of Year 5. The investment offers an attractive IRR of 28.7% and an equity multiple of 3.2x over the five-year period.
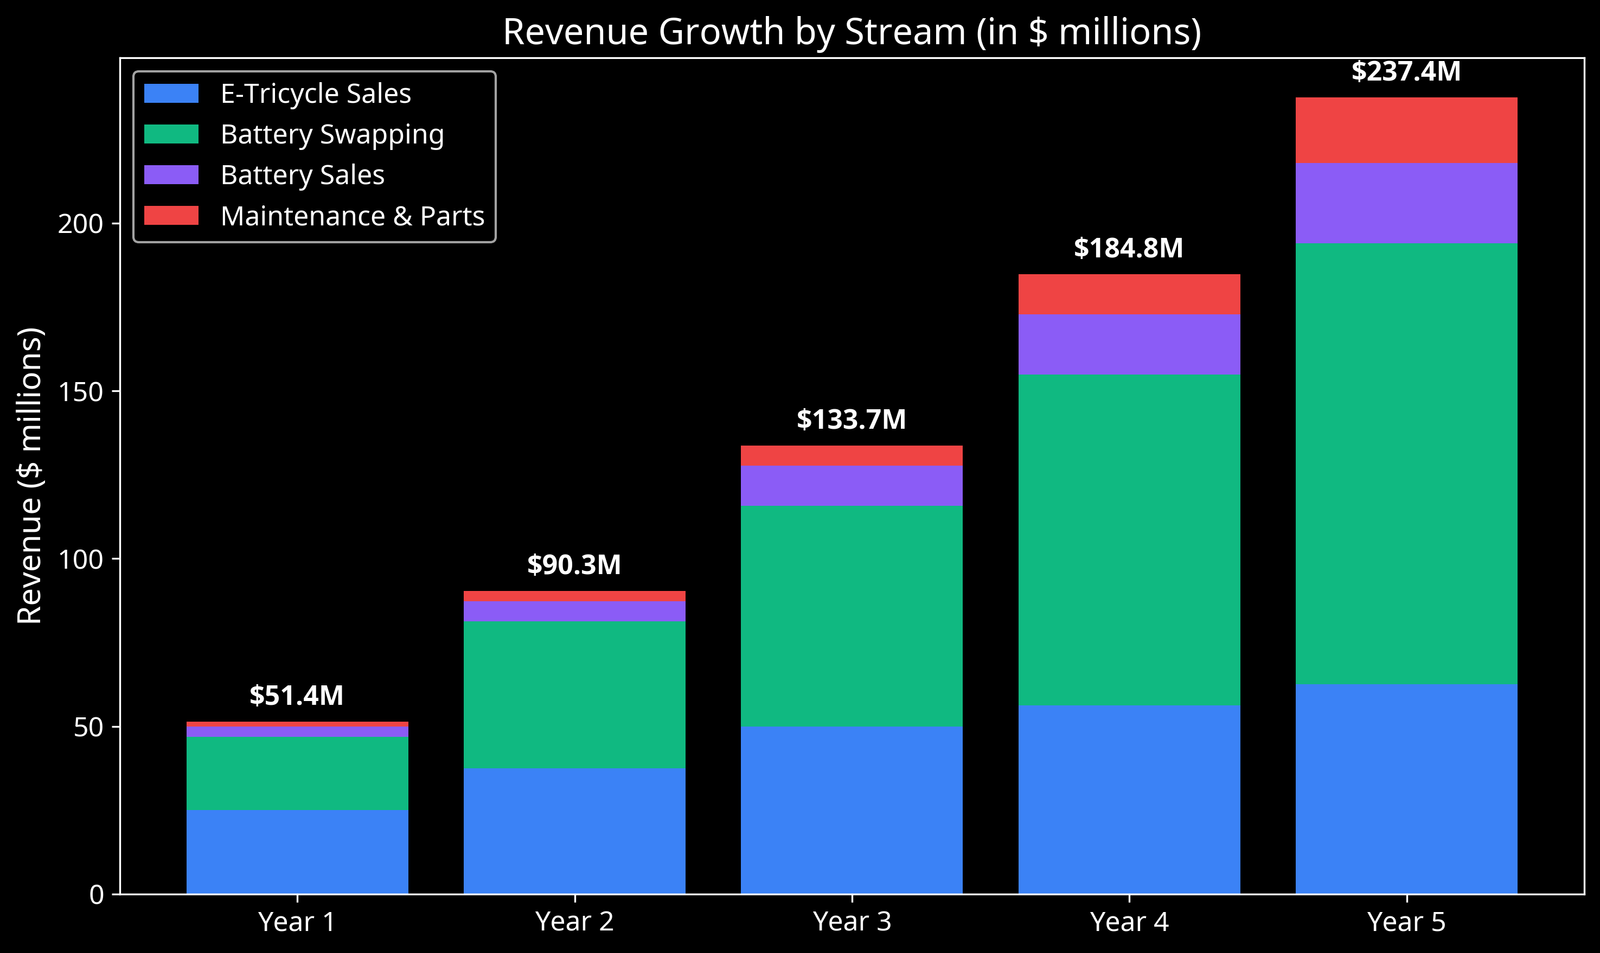
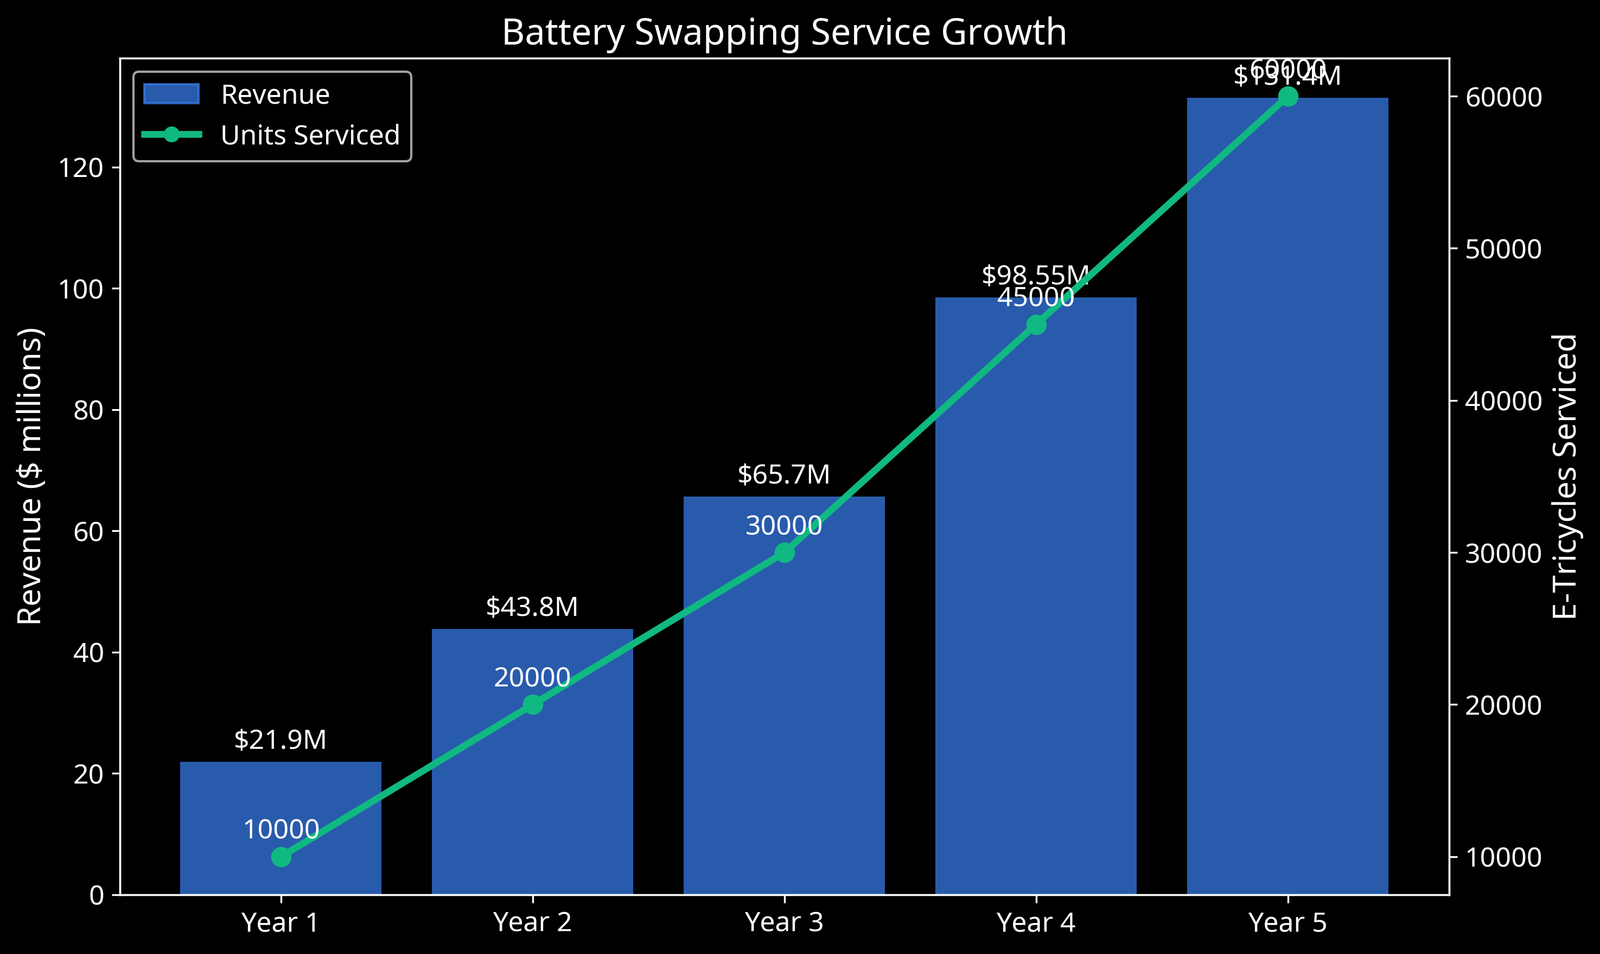
Figure 1: Projected Revenue Growth Over 5 Years
| Category | Amount (USD) | Percentage | Description |
|---|---|---|---|
| E-Tricycle Assembly Plant | $3,500,000 | 35% | Land, building, assembly equipment, testing facilities, initial inventory |
| Sodium-Ion Battery Plant | $4,000,000 | 40% | Manufacturing equipment, R&D laboratory, raw materials inventory |
| Sales & Service Infrastructure | $1,500,000 | 15% | Flagship showrooms, service centers, battery swap stations |
| Working Capital | $1,000,000 | 10% | Operations ramp-up, marketing and launch |
| Total | $10,000,000 | 100% |
| Year | Production Capacity | Capacity Utilization | Units Produced | Units Sold | Average Selling Price (USD) | E-Tricycle Revenue (USD) |
|---|---|---|---|---|---|---|
| 1 | 5,000 | 40% | 2,000 | 1,800 | $3,800 | $6,840,000 |
| 2 | 5,000 | 60% | 3,000 | 2,900 | $3,900 | $11,310,000 |
| 3 | 10,000 | 55% | 5,500 | 5,300 | $4,000 | $21,200,000 |
| 4 | 10,000 | 75% | 7,500 | 7,300 | $4,100 | $29,930,000 |
| 5 | 20,000 | 50% | 10,000 | 9,800 | $4,200 | $41,160,000 |
Figure 2: E-Tricycle Pre-Order Distribution by Region
| Year | Production Capacity | Capacity Utilization | Units Produced | Units Sold | Average Selling Price (USD) | Battery Revenue (USD) |
|---|---|---|---|---|---|---|
| 1 | 5,000 | 30% | 1,500 | 1,200 | $1,200 | $1,440,000 |
| 2 | 5,000 | 50% | 2,500 | 2,300 | $1,150 | $2,645,000 |
| 3 | 10,000 | 40% | 4,000 | 3,800 | $1,100 | $4,180,000 |
| 4 | 10,000 | 60% | 6,000 | 5,800 | $1,050 | $6,090,000 |
| 5 | 20,000 | 45% | 9,000 | 8,700 | $1,000 | $8,700,000 |
Figure 3: Battery Swapping Service Growth Projection
| Year | Maintenance Services (USD) | Battery Swap/Leasing (USD) | Other Services (USD) | Total Service Revenue (USD) |
|---|---|---|---|---|
| 1 | $180,000 | $270,000 | $90,000 | $540,000 |
| 2 | $435,000 | $580,000 | $145,000 | $1,160,000 |
| 3 | $795,000 | $1,060,000 | $265,000 | $2,120,000 |
| 4 | $1,095,000 | $1,825,000 | $365,000 | $3,285,000 |
| 5 | $1,470,000 | $2,940,000 | $490,000 | $4,900,000 |
| Year | E-Tricycle Revenue (USD) | Battery Revenue (USD) | Service Revenue (USD) | Total Revenue (USD) | YoY Growth |
|---|---|---|---|---|---|
| 1 | $6,840,000 | $1,440,000 | $540,000 | $8,820,000 | - |
| 2 | $11,310,000 | $2,645,000 | $1,160,000 | $15,115,000 | 71.4% |
| 3 | $21,200,000 | $4,180,000 | $2,120,000 | $27,500,000 | 81.9% |
| 4 | $29,930,000 | $6,090,000 | $3,285,000 | $39,305,000 | 42.9% |
| 5 | $41,160,000 | $8,700,000 | $4,900,000 | $54,760,000 | 39.3% |
Figure 4: Revenue Composition by Business Segment
Figure 5: Year-over-Year Revenue Growth
| Year | E-Tricycle COGS (USD) | Battery COGS (USD) | Service COGS (USD) | Total COGS (USD) | Gross Margin |
|---|---|---|---|---|---|
| 1 | $5,472,000 | $1,008,000 | $270,000 | $6,750,000 | 23.5% |
| 2 | $8,482,500 | $1,852,000 | $580,000 | $10,914,500 | 27.8% |
| 3 | $15,264,000 | $2,926,000 | $1,060,000 | $19,250,000 | 30.0% |
| 4 | $20,951,000 | $4,263,000 | $1,642,500 | $26,856,500 | 31.7% |
| 5 | $28,812,000 | $6,090,000 | $2,450,000 | $37,352,000 | 31.8% |
| Year | Sales & Marketing (USD) | R&D (USD) | G&A (USD) | Total OpEx (USD) | OpEx as % of Revenue |
|---|---|---|---|---|---|
| 1 | $1,323,000 | $882,000 | $1,764,000 | $3,969,000 | 45.0% |
| 2 | $1,814,000 | $1,209,000 | $2,267,000 | $5,290,000 | 35.0% |
| 3 | $2,750,000 | $1,650,000 | $2,750,000 | $7,150,000 | 26.0% |
| 4 | $3,537,000 | $1,965,000 | $3,144,000 | $8,646,000 | 22.0% |
| 5 | $4,381,000 | $2,738,000 | $3,833,000 | $10,952,000 | 20.0% |
Figure 6: Gross and Operating Margin Evolution
| Year | Revenue (USD) | COGS (USD) | Gross Profit (USD) | OpEx (USD) | EBITDA (USD) | EBITDA Margin | Net Income (USD) | Net Margin |
|---|---|---|---|---|---|---|---|---|
| 1 | $8,820,000 | $6,750,000 | $2,070,000 | $3,969,000 | ($1,899,000) | -21.5% | ($2,649,000) | -30.0% |
| 2 | $15,115,000 | $10,914,500 | $4,200,500 | $5,290,000 | ($1,089,500) | -7.2% | ($1,839,500) | -12.2% |
| 3 | $27,500,000 | $19,250,000 | $8,250,000 | $7,150,000 | $1,100,000 | 4.0% | $70,000 | 0.3% |
| 4 | $39,305,000 | $26,856,500 | $12,448,500 | $8,646,000 | $3,802,500 | 9.7% | $1,961,750 | 5.0% |
| 5 | $54,760,000 | $37,352,000 | $17,408,000 | $10,952,000 | $6,456,000 | 11.8% | $3,469,200 | 6.3% |
Figure 7: EBITDA and Net Income Progression
| Year | EBITDA (USD) | Capital Expenditure (USD) | Working Capital Changes (USD) | Free Cash Flow (USD) | Cumulative FCF (USD) |
|---|---|---|---|---|---|
| 0 | $0 | ($9,000,000) | ($1,000,000) | ($10,000,000) | ($10,000,000) |
| 1 | ($1,899,000) | ($500,000) | ($1,500,000) | ($3,899,000) | ($13,899,000) |
| 2 | ($1,089,500) | ($500,000) | ($1,200,000) | ($2,789,500) | ($16,688,500) |
| 3 | $1,100,000 | ($3,000,000) | ($1,800,000) | ($3,700,000) | ($20,388,500) |
| 4 | $3,802,500 | ($1,000,000) | ($1,500,000) | $1,302,500 | ($19,086,000) |
| 5 | $6,456,000 | ($2,000,000) | ($1,000,000) | $3,456,000 | ($15,630,000) |
| Metric | Value | Description |
|---|---|---|
| 5-Year Cumulative EBITDA | $8,370,000 | Sum of EBITDA over 5 years |
| Terminal Value (Year 5) | $64,560,000 | Based on 10x EBITDA multiple |
| Net Present Value (NPV) | $18,700,000 | At 15% discount rate |
| Internal Rate of Return (IRR) | 28.7% | Based on initial $10M investment and terminal value |
| Equity Multiple | 3.2x | Terminal value divided by initial investment |
| Payback Period | 4.3 years | Time to recover initial investment |
Figure 8: Investment Returns Analysis
Figure 9: Return on Investment Analysis
| EBITDA Multiple | Terminal Value (USD) | IRR | Equity Multiple |
|---|---|---|---|
| 8x | $51,648,000 | 22.8% | 2.6x |
| 10x | $64,560,000 | 28.7% | 3.2x |
| 12x | $77,472,000 | 33.9% | 3.9x |
| 14x | $90,384,000 | 38.5% | 4.5x |
| Revenue CAGR | Year 5 Revenue (USD) | Year 5 EBITDA (USD) | Terminal Value (USD) | IRR |
|---|---|---|---|---|
| 40% | $47,500,000 | $5,225,000 | $52,250,000 | 23.5% |
| 50% | $54,760,000 | $6,456,000 | $64,560,000 | 28.7% |
| 60% | $62,500,000 | $7,812,500 | $78,125,000 | 33.8% |
| Ratio | Year 1 | Year 2 | Year 3 | Year 4 | Year 5 |
|---|---|---|---|---|---|
| Gross Margin | 23.5% | 27.8% | 30.0% | 31.7% | 31.8% |
| EBITDA Margin | -21.5% | -7.2% | 4.0% | 9.7% | 11.8% |
| Net Profit Margin | -30.0% | -12.2% | 0.3% | 5.0% | 6.3% |
| Return on Investment (ROI) | -26.5% | -18.4% | 0.7% | 19.6% | 34.7% |
| Debt-to-Equity Ratio | 0.0 | 0.0 | 0.0 | 0.0 | 0.0 |
| Use of Funds | Amount (USD) | Percentage | Timeline |
|---|---|---|---|
| Land Acquisition | $1,200,000 | 12.0% | Month 1-3 |
| Building Construction/Renovation | $1,800,000 | 18.0% | Month 2-6 |
| E-Tricycle Assembly Equipment | $1,200,000 | 12.0% | Month 4-8 |
| Battery Manufacturing Equipment | $2,500,000 | 25.0% | Month 4-8 |
| R&D Laboratory Setup | $800,000 | 8.0% | Month 5-9 |
| Initial Inventory | $1,000,000 | 10.0% | Month 7-12 |
| Sales Infrastructure | $800,000 | 8.0% | Month 9-15 |
| Working Capital | $700,000 | 7.0% | Month 1-18 |
| Round | Timing | Amount (USD) | Purpose |
|---|---|---|---|
| Series B | Year 3 | $15,000,000 | Capacity expansion, international market entry |
| Series C | Year 5 | $25,000,000 | Scaling operations, technology advancement, market expansion |